
How is this different from regular image AI?
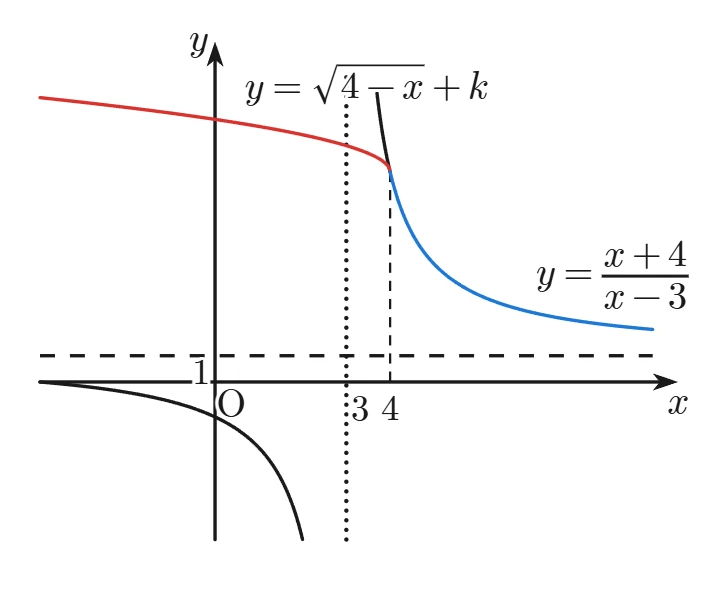
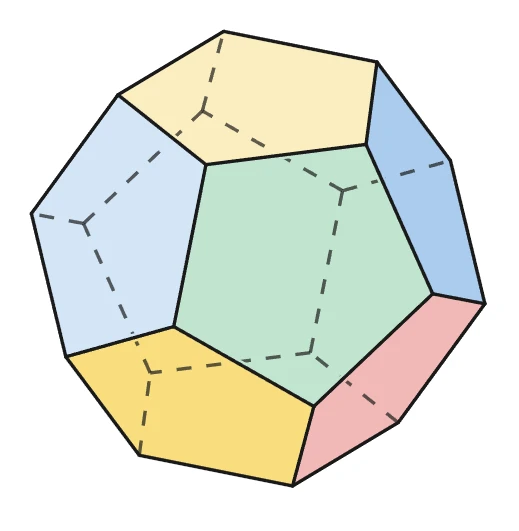
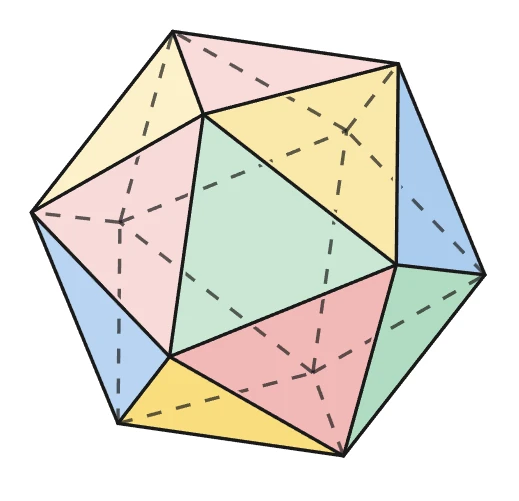
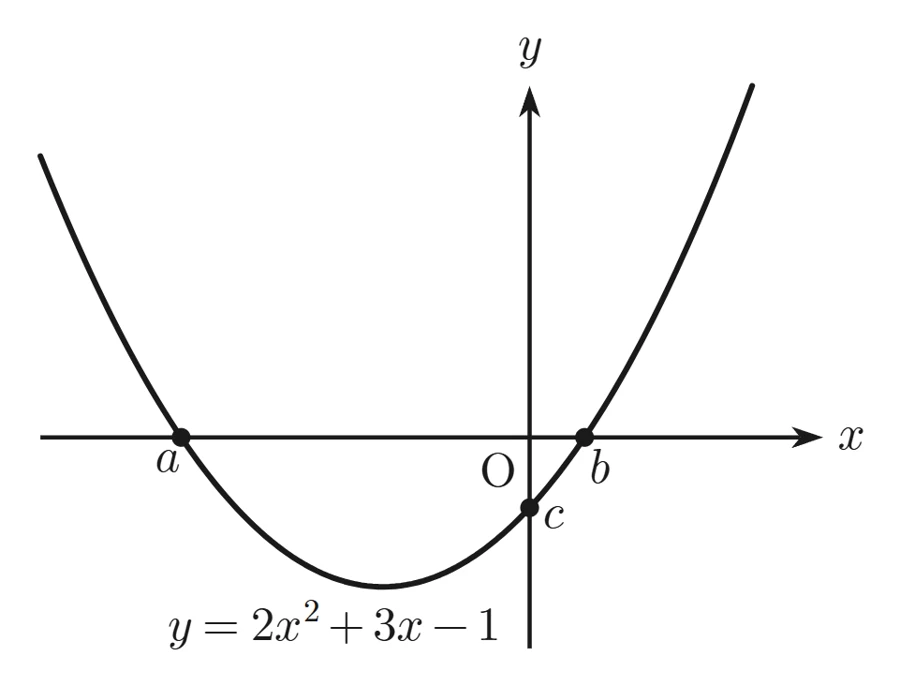
Geometric figures and function graphs are something regular image-generating AI simply can’t do well. It’s baked into how it works: it treats a math graph like a landscape painting. So of course it can’t keep exact shapes, or give you the graph you want while keeping the previous one exactly as it was. So I built my own.
It doesn’t draw
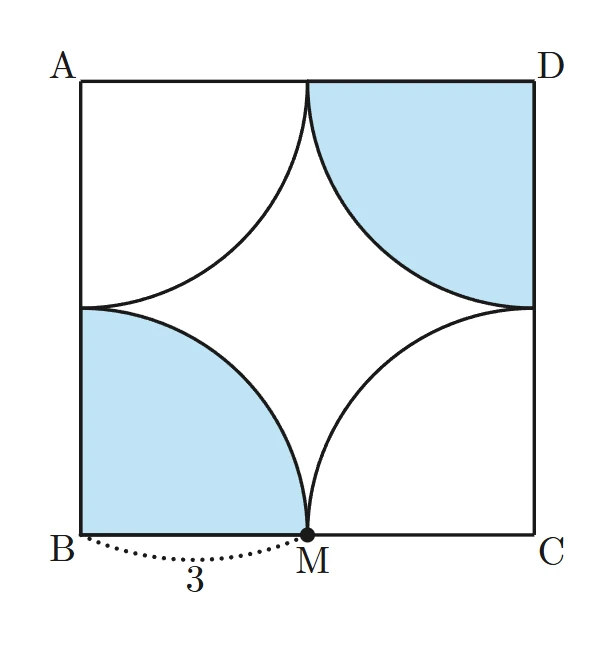
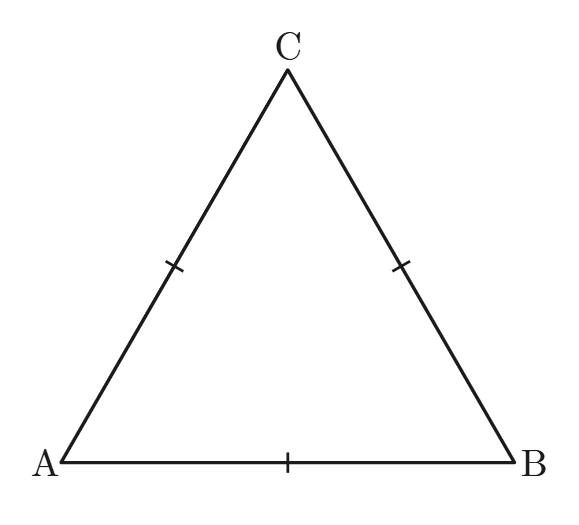
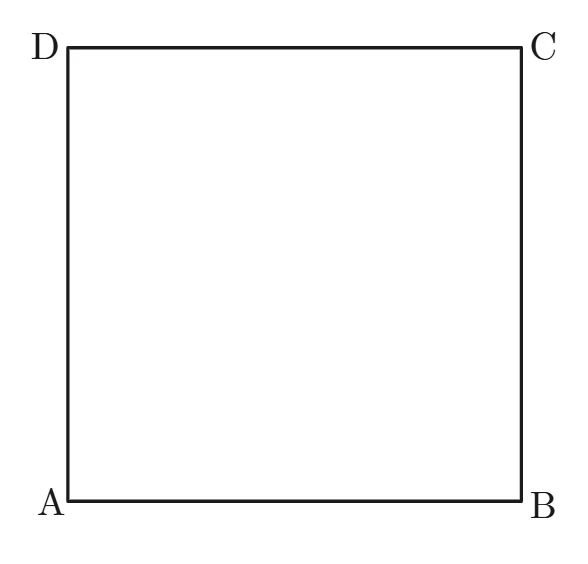
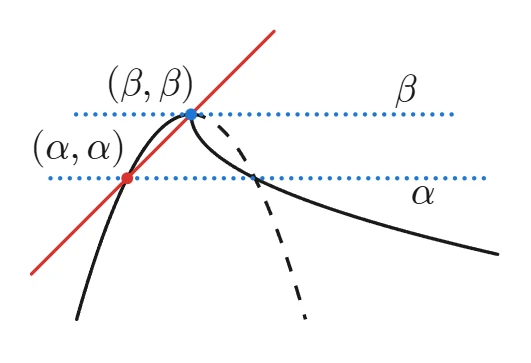
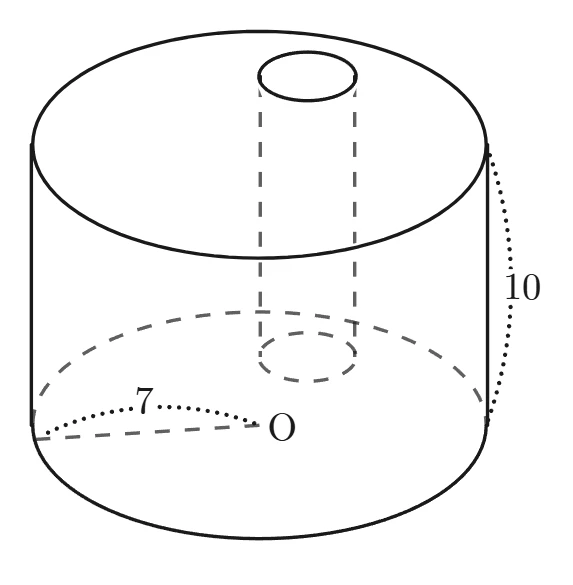
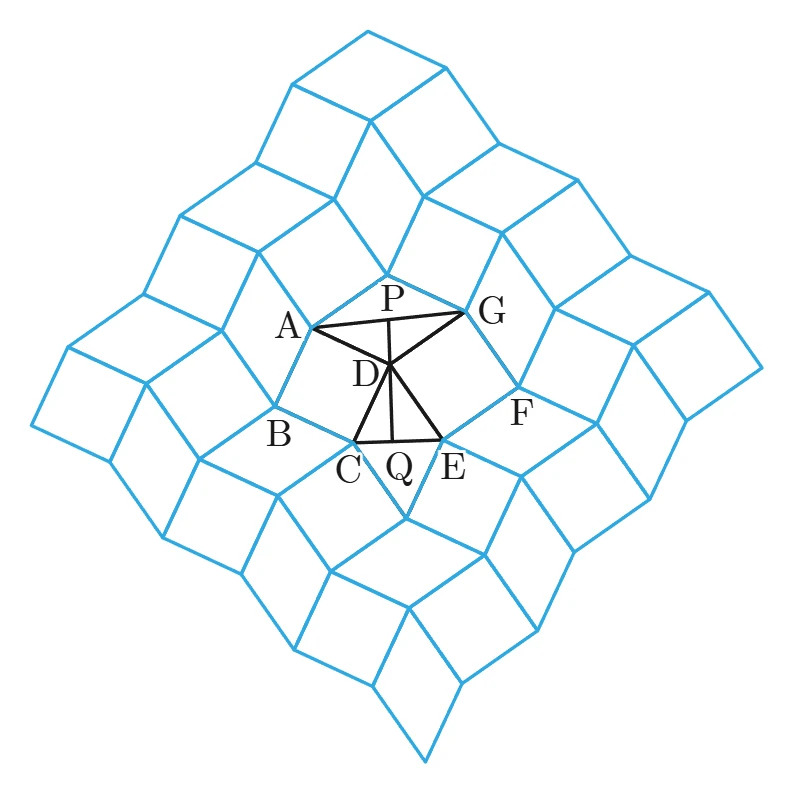
The AI doesn’t paint the picture. It constructs it, as you would with compass and straightedge, so lengths and angles come out exact.
It understands what you say
You can’t explain a landscape painting in words. You can explain a construction.
Ready to use
Because I made it for myself. It had better be ready to use.
Reusable
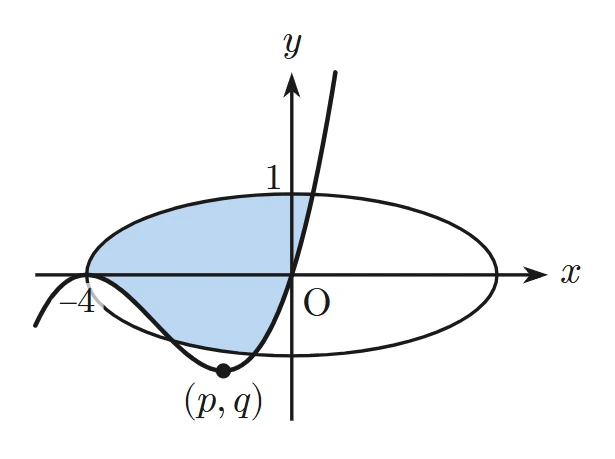
Normally a figure is useless once the problem changes. Here, a small edit request fixes it, easily and exactly.
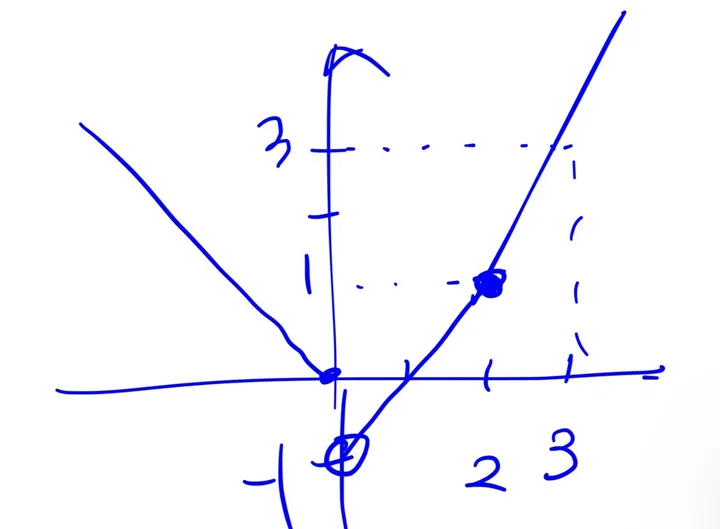
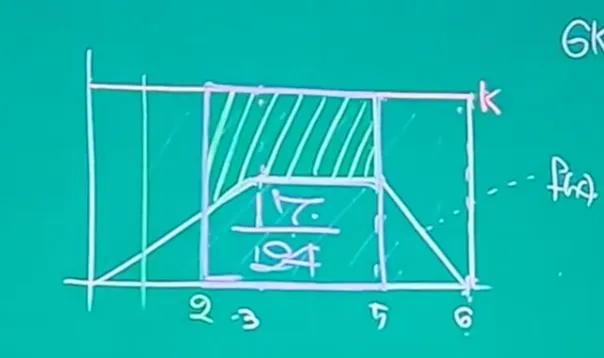
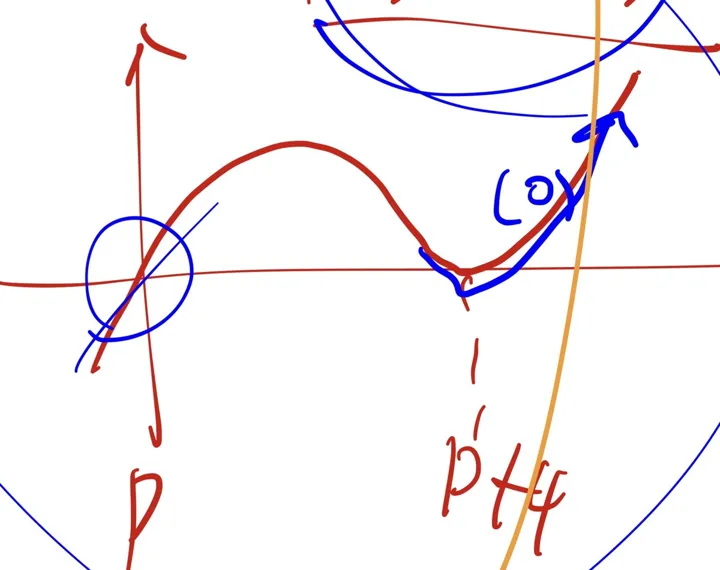
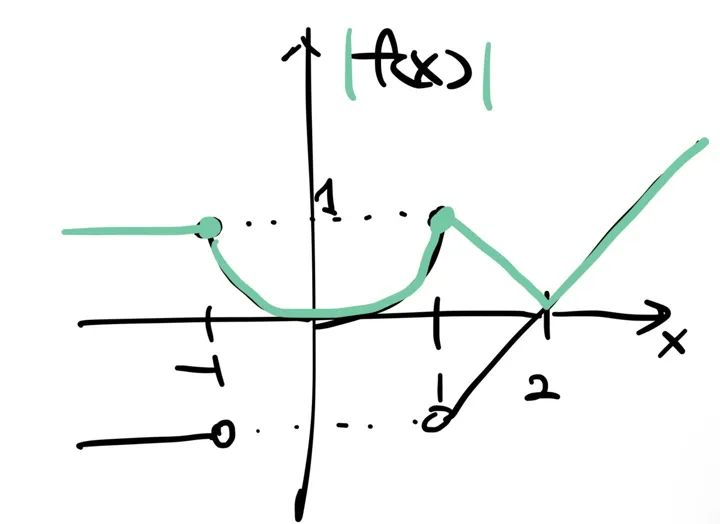
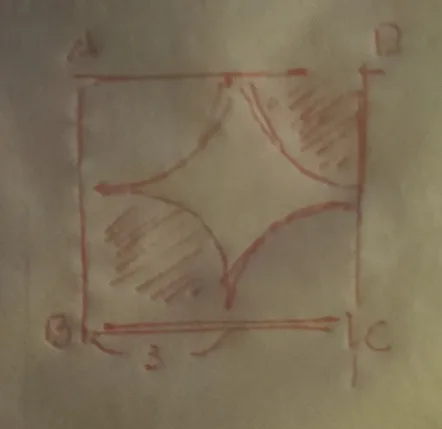
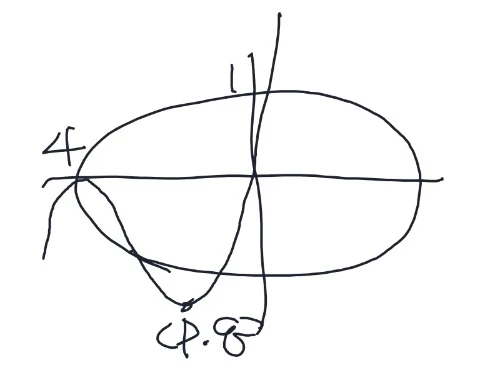
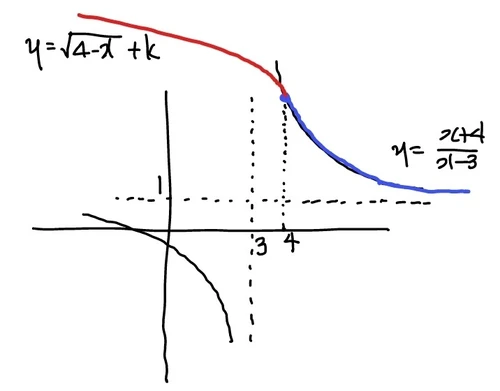
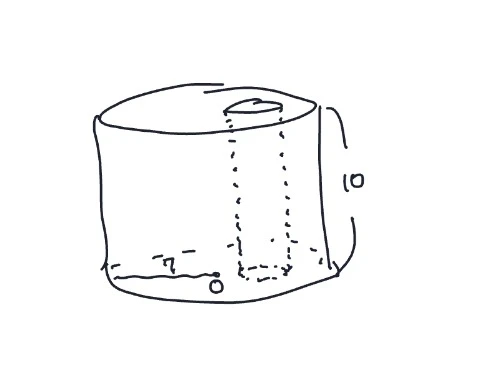
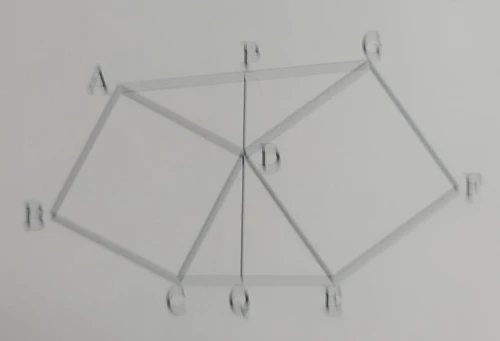
Want to tweak a past exam question but need the graph? Snap a photo and try writing this:
+“keep the y-intercept and change the slope to 2”
Build a little image library for your own materials.
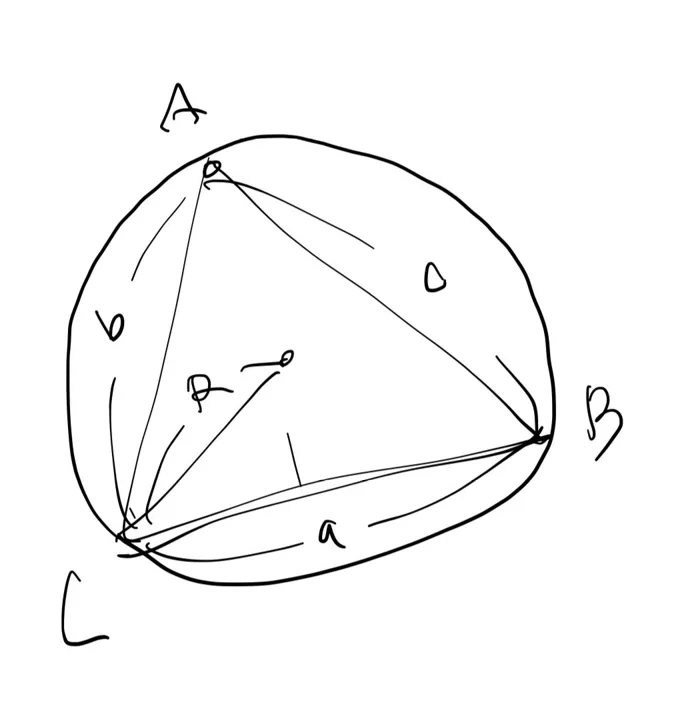
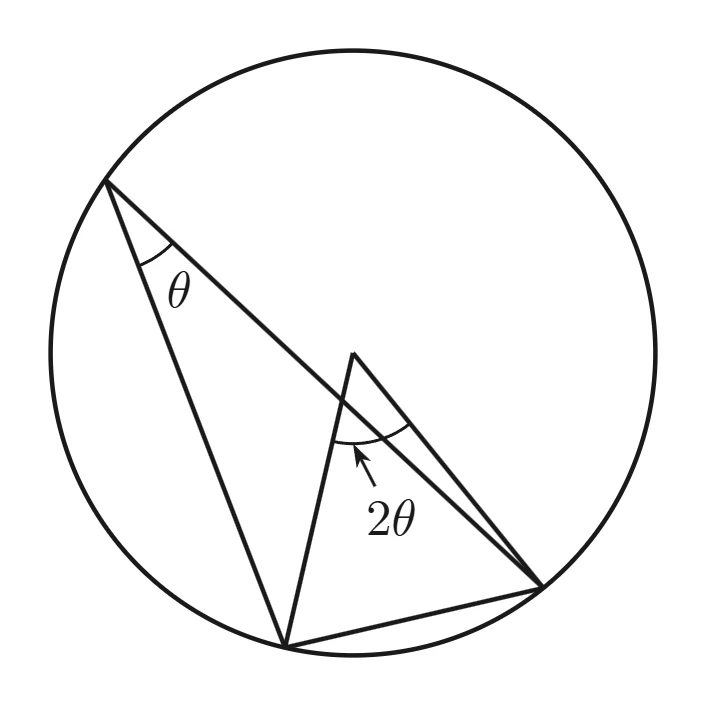
How to use - Draw it yourself?
- 1
- 2
- 3
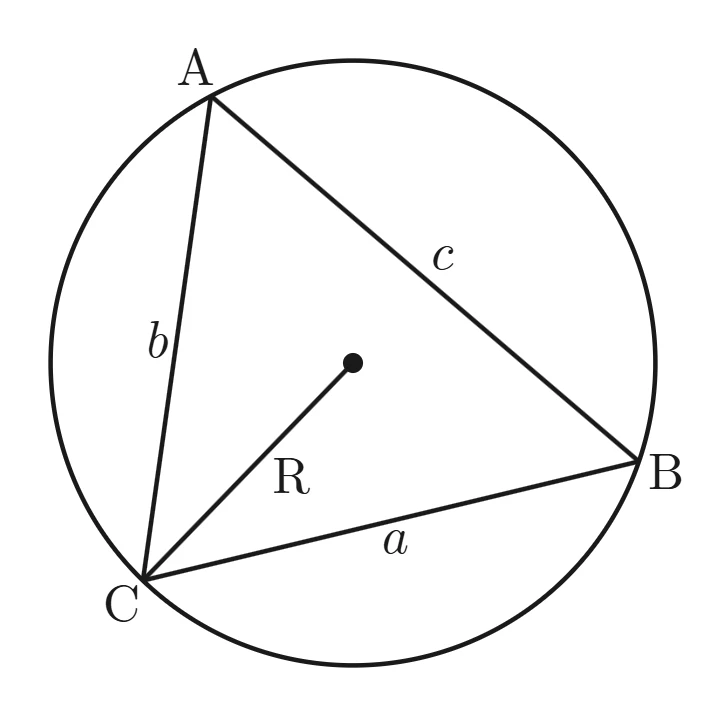
How to use - Upload a photo
- 1
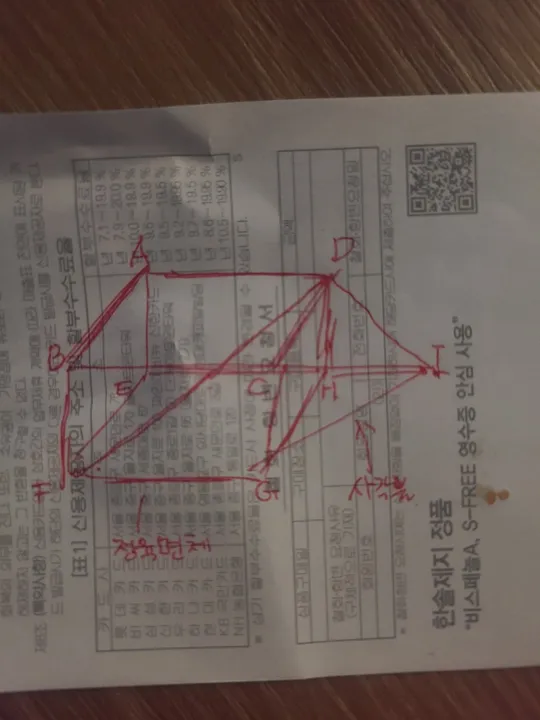
- 2
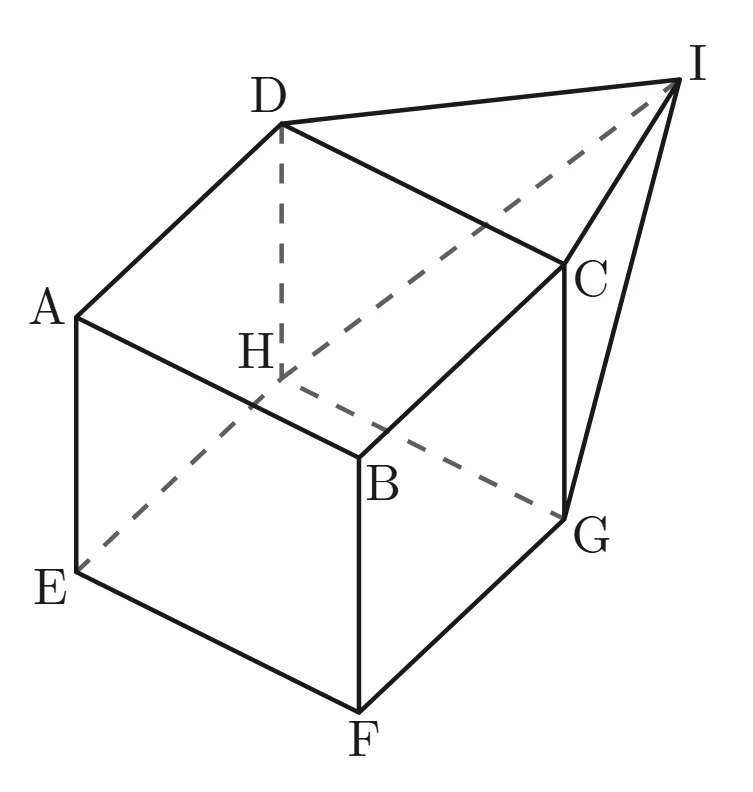 ..?
- 3
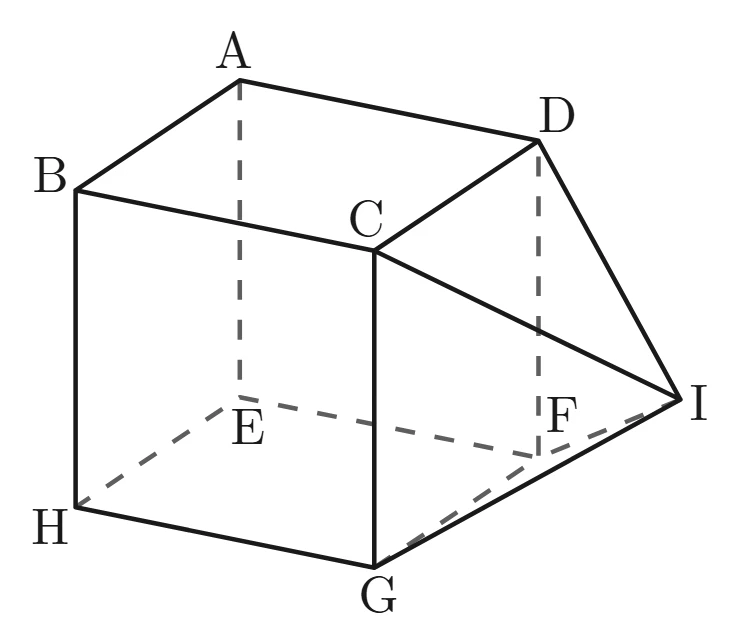 PNG
How to use - Just describe it!
- 1
- 2
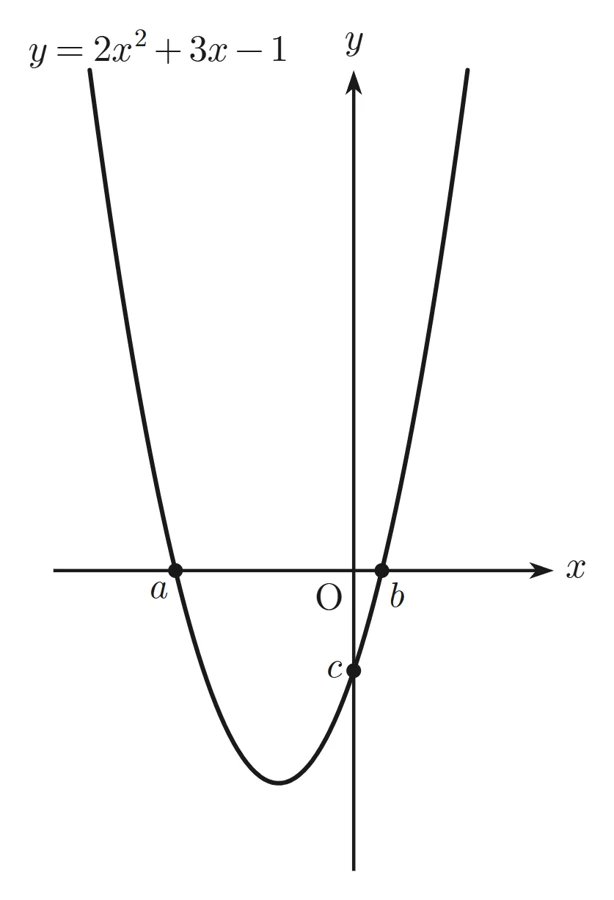 Hmm.. it's too tall, make it 4:3
- 3
What makes it different
Whipped up by a math teacher who's also been programming for 20 years.
Flashy graphics!
Dazzling! Or not. Whatever.
It's free?
As if. It's paid.
Revise with words!
This one actually works.
Draw it with your feet!
We tried. It kind of works.